backend
The Absolute Easiest Way to Debug Node.js - with VS Code
Let’s face it…debugging Node.js is (and always has been) kind of a pain.
Enter the Pain of Debugging in Node.js
If you’ve ever had the pleasure of writing code for a Node.js project, you know what I’m talking about when I say debugging it to figure out what’s going wrong isn’t the easiest thing.
Unlike JavaScript in the browser, or Java with a powerful IDE like IntelliJ, you can’t just set breakpoints everywhere, refresh the page or restart the compiler and slowly walk through the code examining objects, evaluating functions and finding the mutation or missing variable, etc. You just can’t, and it stinks.
But Node is possible to debug, it just takes a little more elbow grease.
Let’s go over the debugging options and then I’ll show you the easiest way I’ve come across to debug Node.js in my own development.
Options to debug in Node.js
There’s a number of ways to debug your misbehaving Node.js program, I’ve listed them out below with links to learn more if you so desire.
console.log()— the tried and true standby, this one really needs no further explanation if you’ve ever written a line of JavaScript. It’s built in to Node.js and prints in the terminal just like it’s built into JavaScript and prints in the browser’s console.
In Java, it’s System.out.println(), in Python it’s print() - you get the idea. This is the easiest one to implement, and it’s the fastest way to litter your clean code with extra lines of info — but it can also (sometimes) help you find and fix the error.
- Node.js documentation
—-inspect— The Node.js docs themselves understand debugging isn’t the easiest, so they’ve made a handy reference to help get people started.
It’s useful, but honestly, unless you’ve been programming for a while, it’s not exactly the easiest thing to decipher. They pretty quickly go down the rabbit hole of UUIDs, WebSockets, and security implications and I start to feel in over my head. And thinking to myself: there’s got to be a less complex way to do this.
- Chrome DevTools — Paul Irish wrote a great blog post back in 2016 (updated in 2018) about debugging Node.js using Chrome DevTools, and from the looks of things it sounded pretty simple, and like a great step forward for debugging.
Fast forward half an hour, and I still hadn’t managed to connect a DevTools window to my simple Node program and I wasn’t so sure anymore. Maybe I just can’t follow directions, but Chrome DevTools seems to make it more complicated to debug than it should be.
- JetBrains — one of my very favorite software development companies and makers of IntelliJ and WebStorm to name just a few IDEs, JetBrains is great. They’ve got a fantastic ecosystem of plugins for their tools and until recently, they were my go-to IDE without question.
With such a dedicated user base came lots of helpful articles like this, which walk through debugging Node, but similar to the Node documentation and the Chrome DevTools options, it’s not easy. You have to create a debugging configuration, attach running processes and do a good bit of configuration in the preferences before WebStorm is ready to go.
- Visual Studio Code — this is my new gold standard for Node debugging. I never thought I’d say it, but I am all in on VS Code, and every new feature release the team does, makes me love this IDE more.
VS Code does what every other option for debugging Node.js fails to do, it makes it stupid simple. If you want to get fancier with your debugging you absolutely can, but they break it down to make it simple enough anyone can get up and running quickly, regardless of how familiar you are with IDEs, Node, programming, etc. And it’s awesome.
Setting up VS Code to debug in Node.js
Sorry, I couldn’t resist this meme — it’s just so appropriate.
Ok, so let’s walk through setting up VS Code to debug Node. I’ll assume you’ve already downloaded VS Code from the link I posted above, so we’re ready to start setting it up.
In VS Code, open up Preferences > Settings and in the search box type in “node debug”. Under the Extensions tab there should be one extension titled “Node debug”. From here, click the first box: Debug > Node: Auto Attach and set the drop down to “on”. You’re almost ready to go now. Yes, it really is that easy.
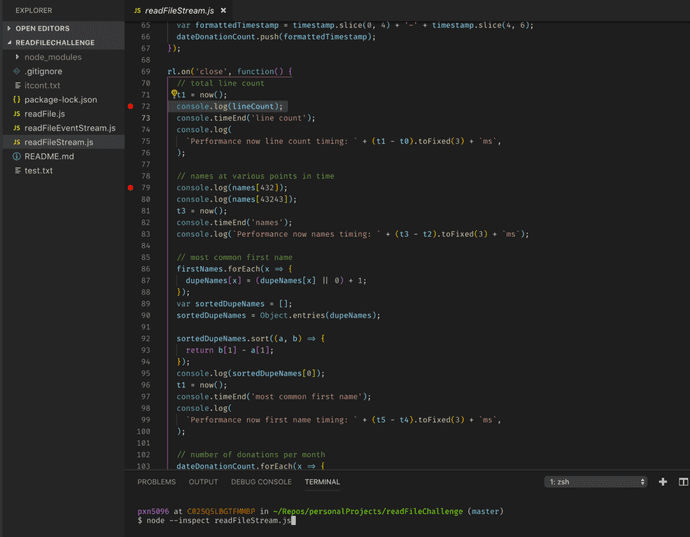
Now, go to your Node.js project file, and set some breakpoints by clicking on the left hand side of the file wherever you’d like to see your code stop, and in the terminal type node --inspect <FILE NAME>. Now watch the magic happen…
VS Code debugging in action
If you need a Node.js project to test this out with, you can download my repo here. It was made to test different forms of streaming large amounts of data with Node, but it works really well for this demo. If you’d like to see more about streaming data with Node and performance optimization, you can see my posts here and here.
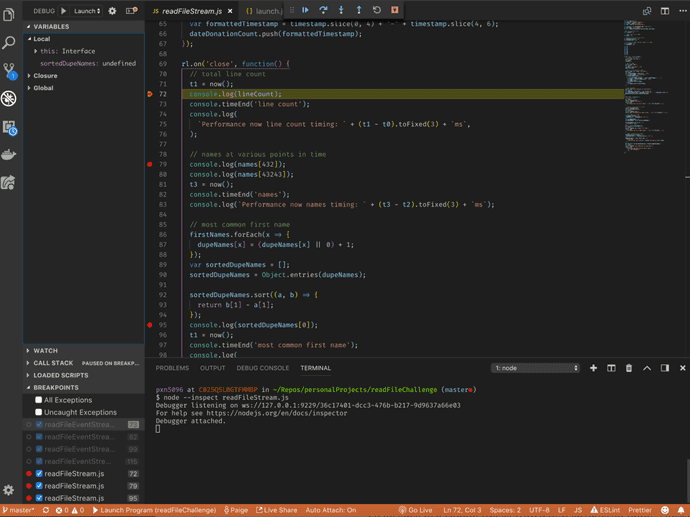
Once you hit Enter, your VS Code terminal should turn orange at the bottom to indicate you’re in debug mode and your console will print some message along the lines of "Debugger Attached".
Once you see this happening, congrats, you’re running in debug mode in Node.js!
Now, you can see your breakpoints in the bottom left corner of the screen (and can toggle them on and off with the checkboxes), and you can step through the code just like you would in a browser with the little play, step over, step in, restart, etc. buttons at the top center of the IDE. VS Code even highlights the breakpoint and line you’ve stopped on with yellow, making it easier to follow along.
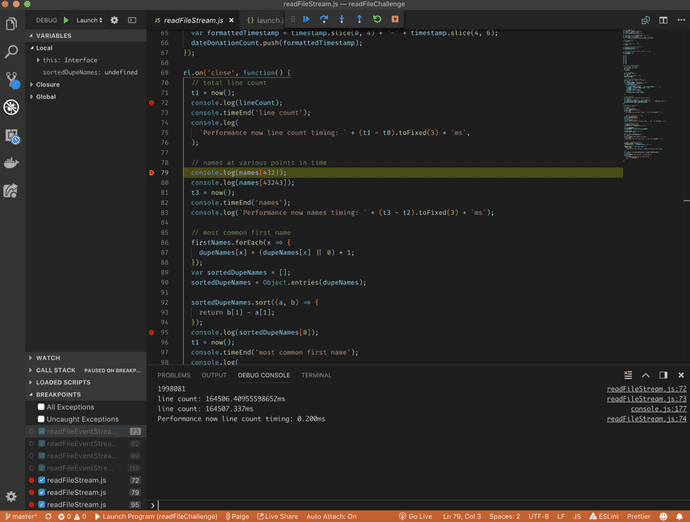
As you step from breakpoint to breakpoint, you can see the program printing out the console.logs in the debug console at the bottom of the VS Code IDE and the yellow highlighting will travel with you, as well.
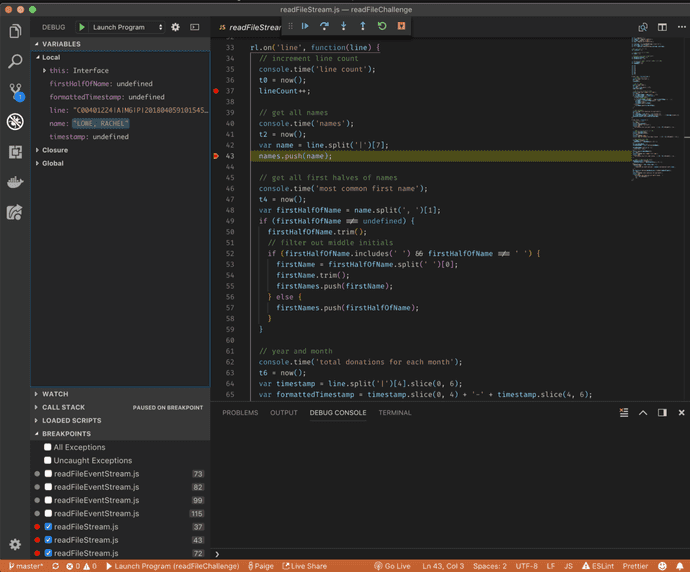
As you can see, as I progress through the program, more prints out to the debug console the further through the breakpoints I go, and along the way, I can explore the objects and functions in the local scope using the tools in the upper left hand corner of VS Code, just like I can explore scope and objects in the browser. Nice!
That was pretty painless, huh?
Conclusion
Node.js debugging doesn’t have to be the headache it was in the past, and it doesn’t need to involve 500 console.log()s in the codebase to figure out where the bug is.
Visual Studio Code’s Debug > Node: Auto Attach setting makes that a thing of the past, and I, for one, am so thankful.
Check back in a few weeks, I’ll be writing about end-to-end testing with Puppeteer and headless Chrome or using Nodemailer to reset passwords in a MERN application, so please follow me so you don’t miss out.
Thanks for reading, I hope this gives you an idea of how to more easily and effectively debug your Node.js programs with a little assistance from VS Code.
References & Further Resources
- Github, Node Read File Repo
- Node.js documentation, inspector
- Paul Irish’s blog on using Chrome DevTools to debug Node.js
- JetBrains documentation, Running and Debugging Node.js
- Visual Studio Code download
- VS Code debugging Node.js docs
Want to be notified first when I publish new content? Subscribe to my newsletter.


